
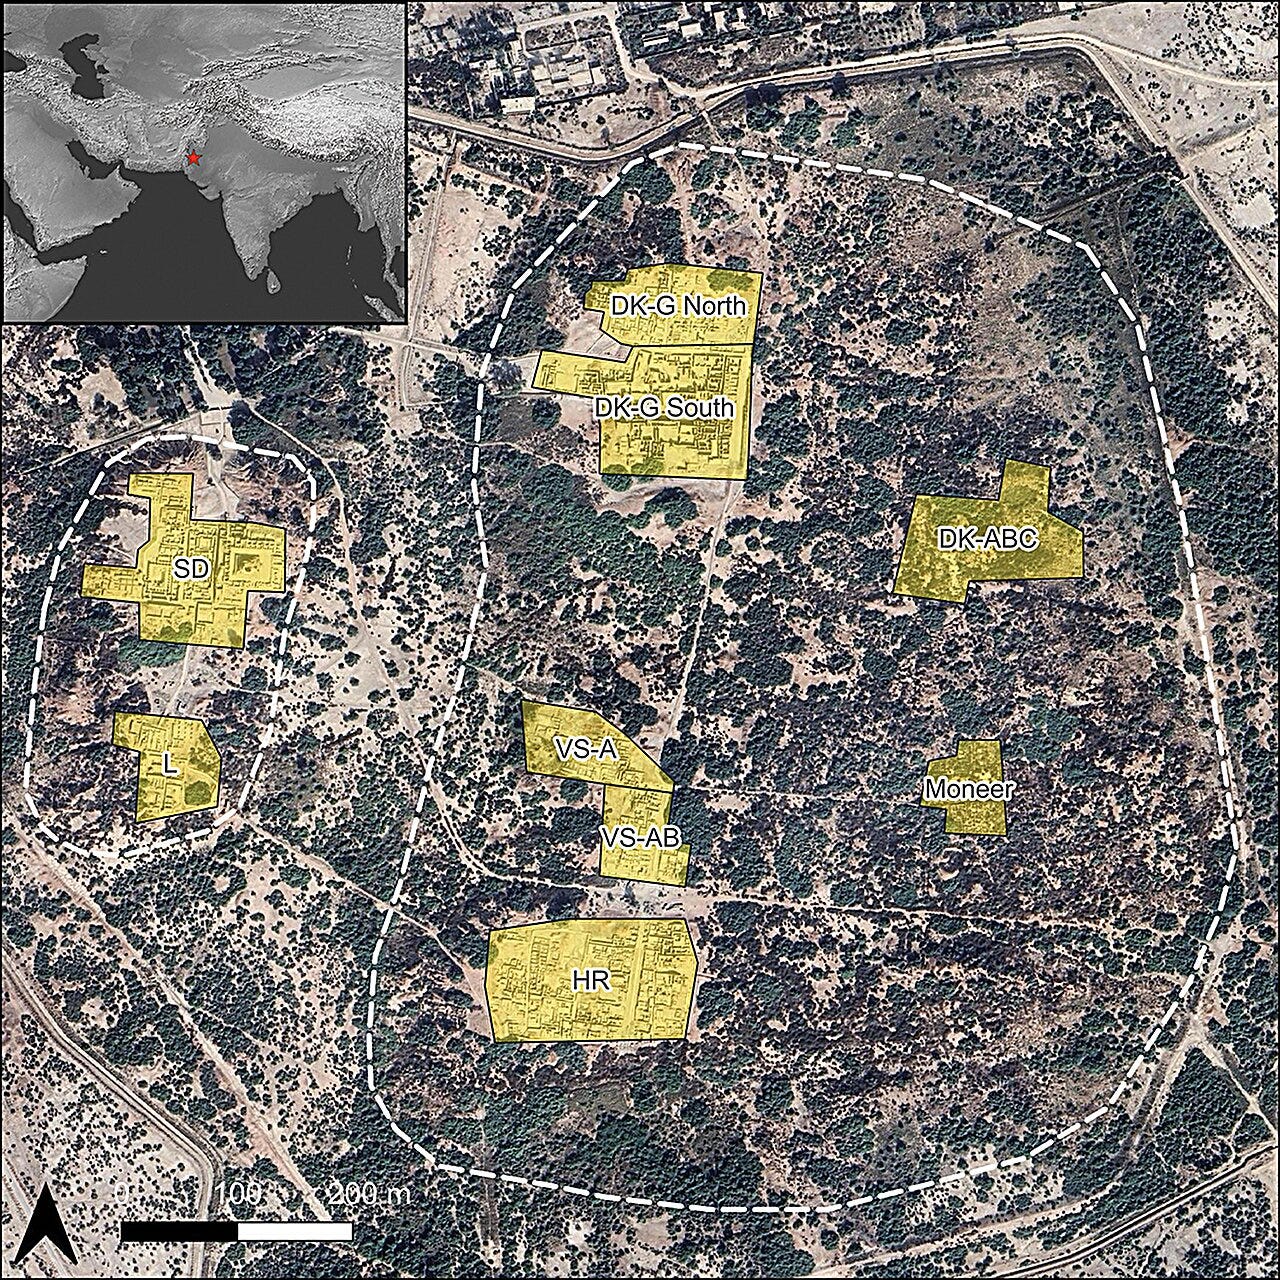
In the oldest levels of a neighborhood called DK-G South, the houses are large. The largest date to around 2500 BC and cover more than 160 square meters of floor plan. This isn’t surprising for a Bronze Age city. What’s surprising is what happens next.
Over the following four centuries, as Mohenjo-daro continued to grow and fill in, housing inequality fell. Not marginally. By around 2100 BC, the Gini coefficient of residential disparity in DK-G South had dropped to 0.23, a figure typical of Neolithic farming villages, not major urban centers. The gap between the largest and smallest homes had narrowed to something archaeologists usually associate with societies that don’t yet have cities.
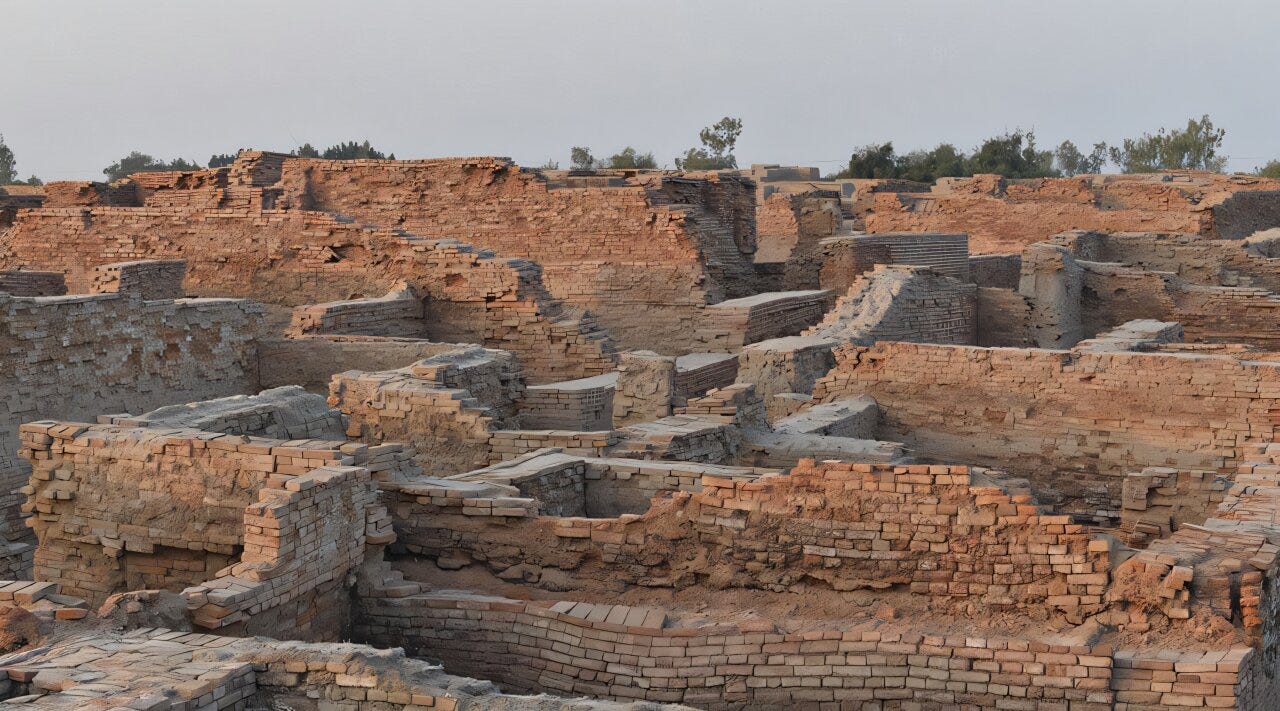
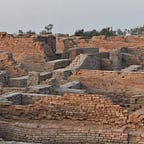
Mohenjo-daro had tens of thousands of residents. It had standardized brick construction, a citywide drainage network, a grid of streets, a sophisticated system of weights and measures, and a vigorous long-distance trade network that extended to Mesopotamia. It was, by any reasonable measure, one of the most functionally complex urban environments on earth in the third millennium BC. And it appears to have been getting more equal as it matured.
That finding is the core of a new study by Adam Green, Iqtedar Alam, and Cameron Petrie, published in Antiquity1 in 2026. Their analysis draws on excavation data from the earliest twentieth-century digs at the site, converting house footprints into Gini coefficients through a GIS-based approach. The Gini coefficient is a standard economic measure of distributional inequality: zero means total equality, one means total concentration. Their results put the city’s overall residential Gini at 0.44, well below contemporaneous Mesopotamian cities like Ur and Ugarit, which both score above 0.6. The ancient Greek site of Knossos sits at 0.86. The Classic Maya city of Palenque at 0.75.
Mohenjo-daro was already an outlier by those comparisons. But the diachronic data from DK-G South is what makes the study genuinely provocative.
What the houses say
The standard archaeological assumption is that cities generate inequality. The logic is intuitive: larger populations mean more specialization, more specialization means more occupational hierarchy, and hierarchy means wealth concentrates at the top. V. Gordon Childe codified this in his 1950 “urban revolution” framework, which treated social stratification as a defining feature of cities. Neoevolutionary theory went further, treating the state as essentially defined by stratification. If you had a city, you had elites; if you couldn’t find the elites, you weren’t looking hard enough.
Indus archaeologists spent much of the later twentieth century fighting this prior. Mohenjo-daro and the other major Indus sites lack the usual material signatures of hierarchical power: no palaces, no royal tombs, no temples accessible only to a priestly class, no statues of rulers. The arguments went back and forth. Some scholars concluded the Indus must have been a complex chiefdom or non-state. Others countered that a civilization that built cities at this scale must have had elites, even if the evidence was missing. Absence of evidence wasn’t evidence of absence, or so the argument ran.
What Green and colleagues have added is a quantitative dimension to a debate that had stayed largely qualitative. And the quantitative data doesn’t just confirm the impression that Mohenjo-daro was relatively equal. It shows the city moving in a direction opposite to what the theory predicts.
The method has known limitations, which the authors are explicit about. Gini coefficients of house size are not a comprehensive picture of social inequality. They don’t capture differences in movable wealth, in gender or kinship status, or in access to political power that doesn’t manifest architecturally. A wealthy person might not invest in a larger house. A small structure might house a powerful family. The measure also struggles with people who have no residence at all, the poorest members of any ancient city. These caveats matter.
But the measure does capture one real economic dimension: access to labor and resources at the household level. And it allows direct comparison across sites and time periods, which is why the Global Dynamics of Inequality (GINI) project has assembled this kind of data from hundreds of ancient settlements worldwide. Mohenjo-daro now sits in that database, and what it shows is distinctive.
The governance question
The DK-G South sequence tracks five periods from roughly 2500 to 2100 BC. The earliest period shows a Gini of 0.39 and a median house size of 161 square meters. By the latest period, the Gini is 0.23 and the median has dropped to 141 square meters, but with much less variance. The log standard deviation of house areas falls from 0.73 to 0.44 over the same span. Houses weren’t just smaller on average; they were converging toward a common size.
This convergence happened alongside something else: the city’s residences became more uniformly aligned with Mohenjo-daro’s street grid. In the earlier levels, structures are arranged more loosely. In the later levels, they lock into the urban plan. Green and colleagues read this correlation as suggestive of governance, that the same collective decisions that built and maintained public infrastructure also shaped residential space in ways that narrowed the gap between households.
What that governance looked like in practice is uncertain, and the study doesn’t overclaim. There are no deciphered texts from the Indus Civilization, no royal inscriptions, no administrative archives of the kind that survive from Mesopotamia. But the material record offers indirect evidence for distributed authority. Indus seals, small stone stamps that likely facilitated exchange and credit, were found primarily in private residences at Mohenjo-daro rather than in temples or central administrative buildings. In Mesopotamia, equivalent objects concentrated in institutional contexts, where a palace or temple controlled trade. At Mohenjo-daro, the tools of economic governance were spread across the city’s households. Green has previously characterized this contrast in terms of where the power to govern exchange sat: distributed rather than monopolized, and for that reason probably harder to weaponize against ordinary residents.
The same logic extends to the standardized weights and measures used across the entire Indus region. This wasn’t a system enforced from a single administrative center. It was a shared protocol adopted by communities across a vast area, a form of coordination without centralized control.
Green and colleagues point to the decline in residential disparity coinciding with more structured urban development, and suggest that the same governance producing civic amenities may also have constrained how unevenly residential space was distributed. Green has described Mohenjo-daro as having had “deliberative spaces” where collective decisions about the city were made. The new Gini data, tentatively, supports something like that interpretation. The declining inequality wasn’t random drift. It tracked with urban development in a way consistent with intentional decisions about how the city was organized.
One further pattern in the data is worth noting carefully. As inequality declined, productivity appears to have risen. The GINI project uses mean residence area as a rough proxy for household wealth and productivity. In DK-G South, median residence area bottomed out at about 98 square meters in the Late III Period, around 2200 BC, as the Gini was still falling. Then, in the latest period, when the Gini reaches its low of 0.23, median residence area rebounds to 141 square meters. Gregory Possehl had already noted, separately, that there is more evidence for craft production in the city’s later levels. The authors are cautious here, and rightly so: the sample sizes are small and the relationship isn’t statistically robust. But the pattern raises a pointed question about causality.
Development economics since Kuznets has generally assumed that growth generates inequality, and that only after growth reaches a certain threshold does redistribution become viable. Thomas Piketty’s analysis of capitalist economies complicates this picture but doesn’t overturn the basic direction of the arrow. The Mohenjo-daro data, if interpreted at face value, runs that arrow the other way: collective governance constrained inequality, and declining inequality may have contributed to a subsequent rise in productivity. The city’s most equal period appears to be its most productive.
That is a speculative reading, and the paper says so. But it’s the kind of speculation that makes a dataset useful beyond its immediate empirical scope. Mohenjo-daro isn’t a policy prescription. It is a natural experiment, running across four centuries, that complicates the idea that inequality is an unavoidable cost of urban complexity.
The site still holds a great many unanswered questions. The chronological resolution outside DK-G South is poor; most other excavated areas collapse multiple building phases into a single unit, which almost certainly inflates the overall Gini by mixing large early structures with smaller later ones. Future work revisiting structural chronologies from the rest of the site could sharpen the picture considerably. Projects like M-LAB at the Pratt Institute are already working to reinterpret Mohenjo-daro’s legacy datasets with more rigorous methods.
For now, the numbers from DK-G South say something that’s hard to dismiss: as this Bronze Age city built itself into maturity, its wealthiest households and its poorest ones were moving toward each other. That doesn’t happen by accident.
Further Reading
Childe, V.G. 1950. The urban revolution. The Town Planning Review 21: 3–17. https://doi.org/10.3828/tpr.21.1.k853061t614q42qh
Green, A.S. 2020. Debt and inequality: comparing the ‘means of specification’ in the early cities of Mesopotamia and the Indus civilization. Journal of Anthropological Archaeology 60. https://doi.org/10.1016/j.jaa.2020.101232
Green, A.S. 2022. Of revenue without rulers: public goods in the egalitarian cities of the Indus civilization. Frontiers in Political Science 4. https://doi.org/10.3389/fpos.2022.823071
Green, A.S. et al. 2025. Kuznets’ tides: an archaeological perspective on the long-term dynamics of sustainable development. Proceedings of the National Academy of Sciences USA 122. https://doi.org/10.1073/pnas.2400603121
Kohler, T.A. et al. 2025. Introducing the special feature on housing differences and inequality over the very long term. Proceedings of the National Academy of Sciences USA 122. https://doi.org/10.1073/pnas.2401989122
Kuznets, S. 1955. Economic growth and income inequality. The American Economic Review 45: 1–28.
Piketty, T. 2014. Capital in the Twenty-First Century. Cambridge, MA: Harvard University Press.
Possehl, G.L. 2002. The Indus Civilization: A Contemporary Perspective. Walnut Creek, CA: AltaMira.
Green, A.S., Alam, I. & Petrie, C. 2026. Inequality declined in the Bronze Age city of Mohenjo-daro. Antiquity. https://doi.org/10.15184/aqy.2026.10359


